dv-board
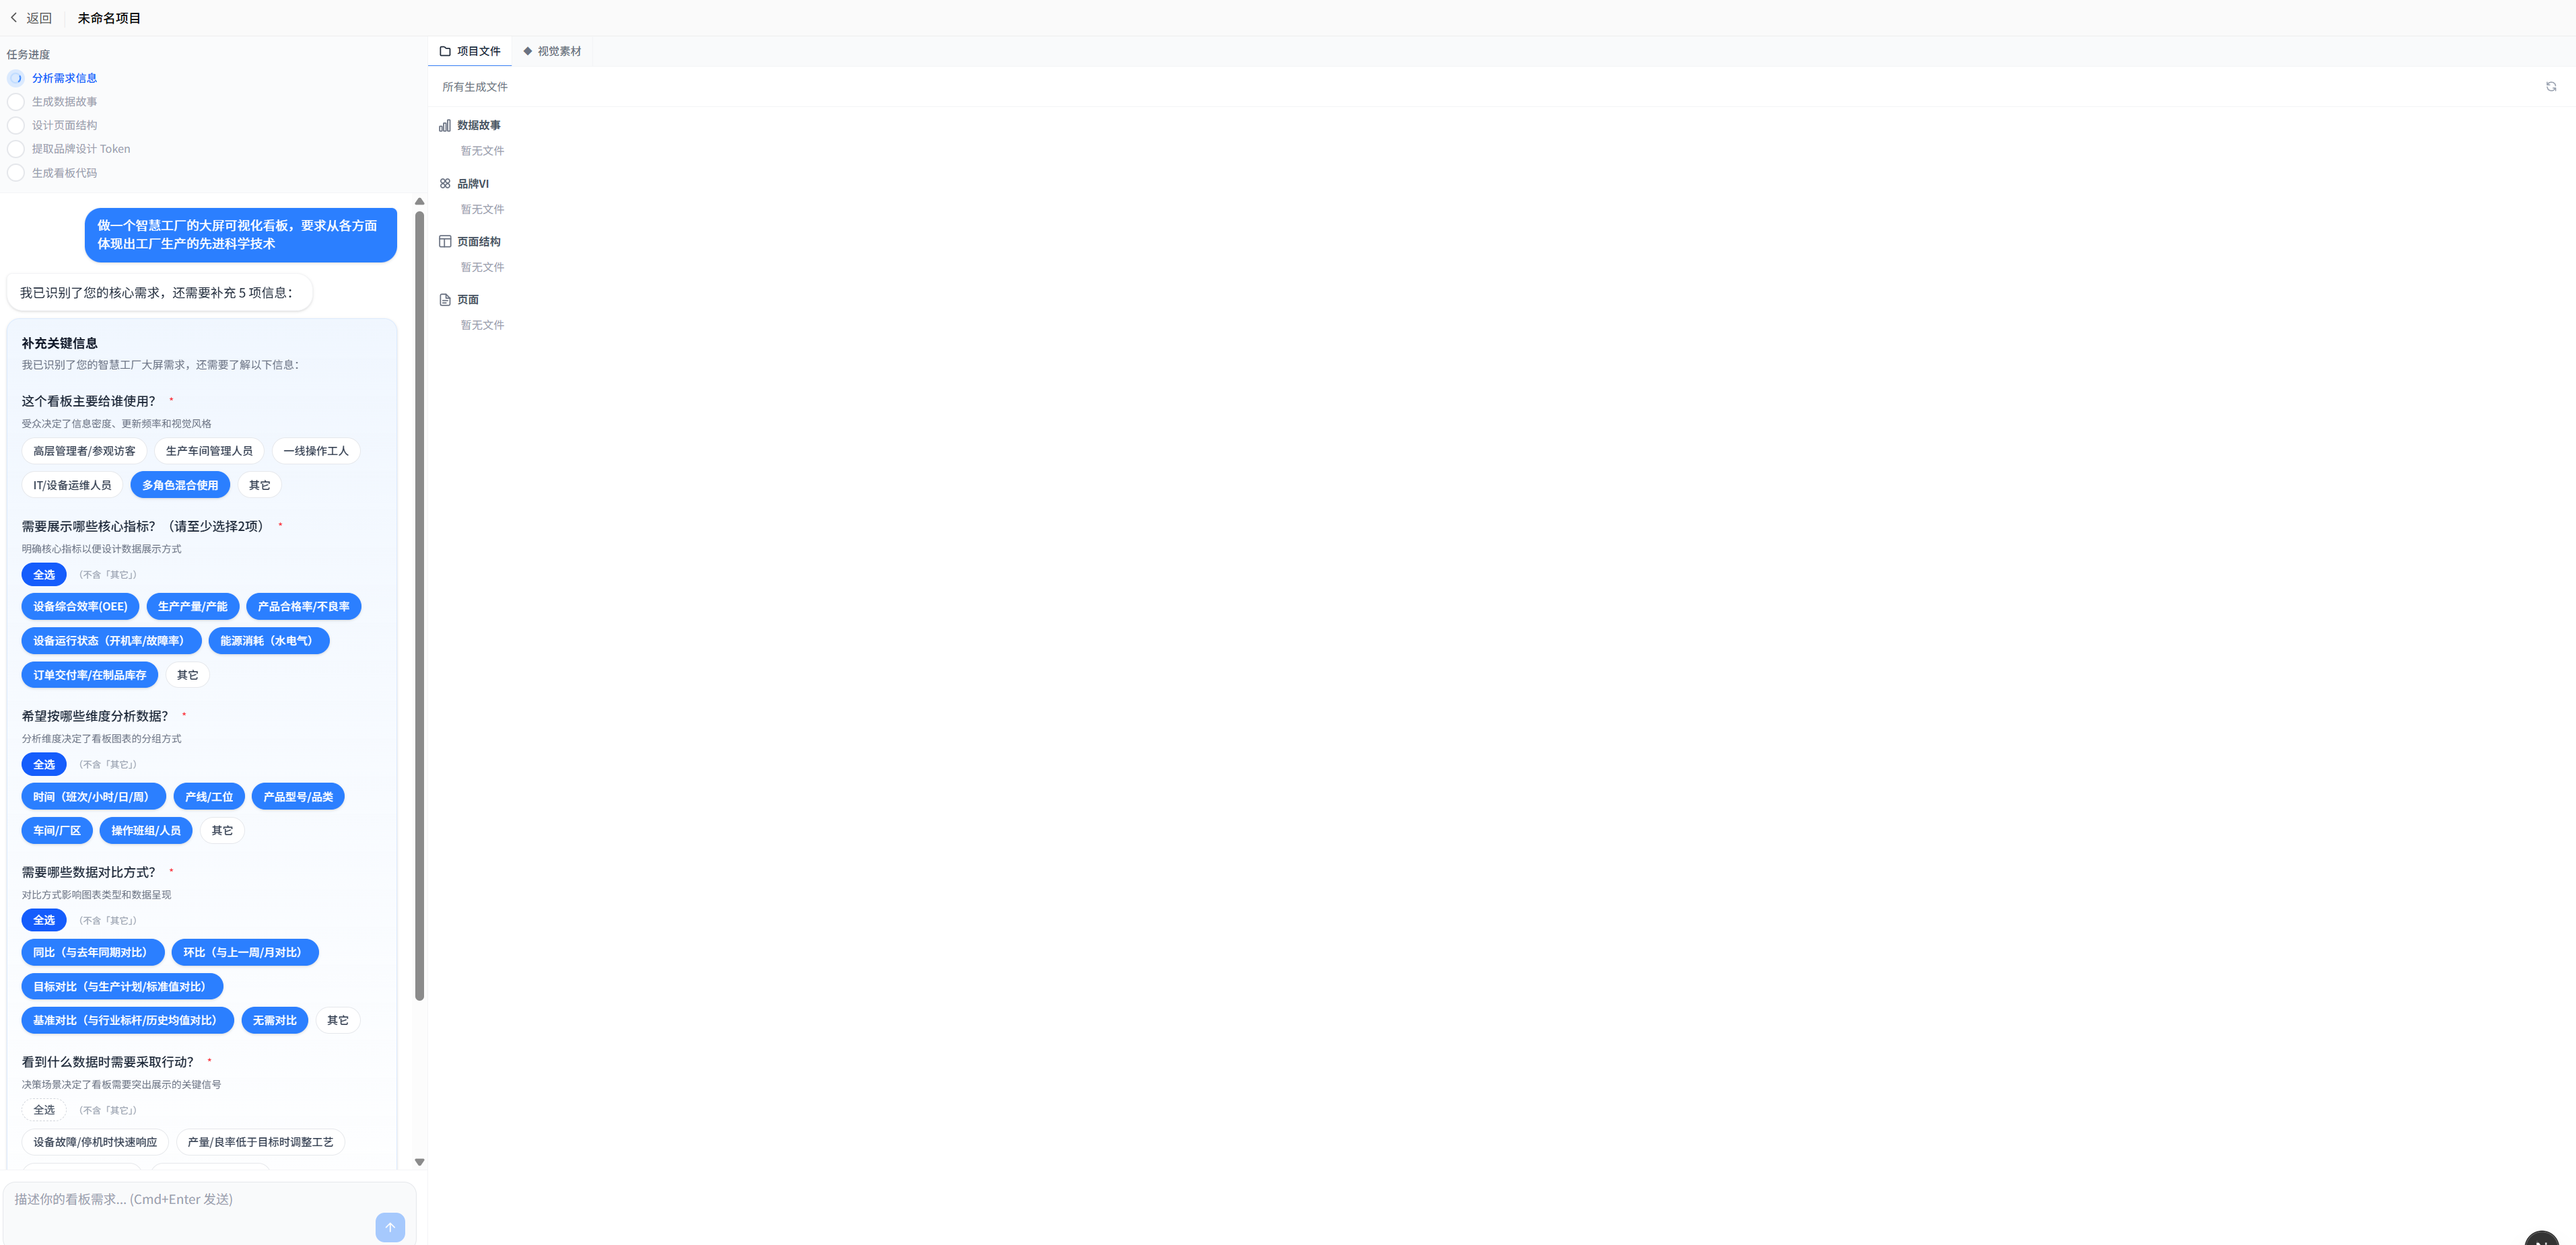
Describe what you need in natural language. AI generates a production-ready data visualization dashboard.
ビデオ
テックスタック
説明
Describe what you need in natural language. AI generates a production-ready data visualization dashboard.
Philosophy
Traditional BI tools produce JSON configurations — unreadable to humans, opaque to AI. DV Board takes a different path:
The deliverable is code, not configuration. Generated Markdown documents and JSX components are both human-readable design artifacts and source code that AI can directly understand and modify. Every conversational edit hits the mark precisely, with no guesswork through configuration mappings.
Core Features
📁 Files as Memory
Each project's full context is persisted as plain-text files in the .dv/ directory:
.dv/project-{id}/
├── 数据故事/design-story.md      # Business goals, metrics, decision scenarios
├── 页面结构/pages-story.md       # Layout planning, component specs, data contracts
├── 品牌VI/vi-system.md           # Visual identity specification
├── 品牌VI/vi-tokens.json         # CSS variables, color palette, typography tokens
└── 页面/dashboard.jsx            # Final renderable React component
AI reads these files as long-term memory on every conversation turn, understanding the full project context before making incremental changes. Projects are inherently Git-friendly, team-shareable, and tool-portable.
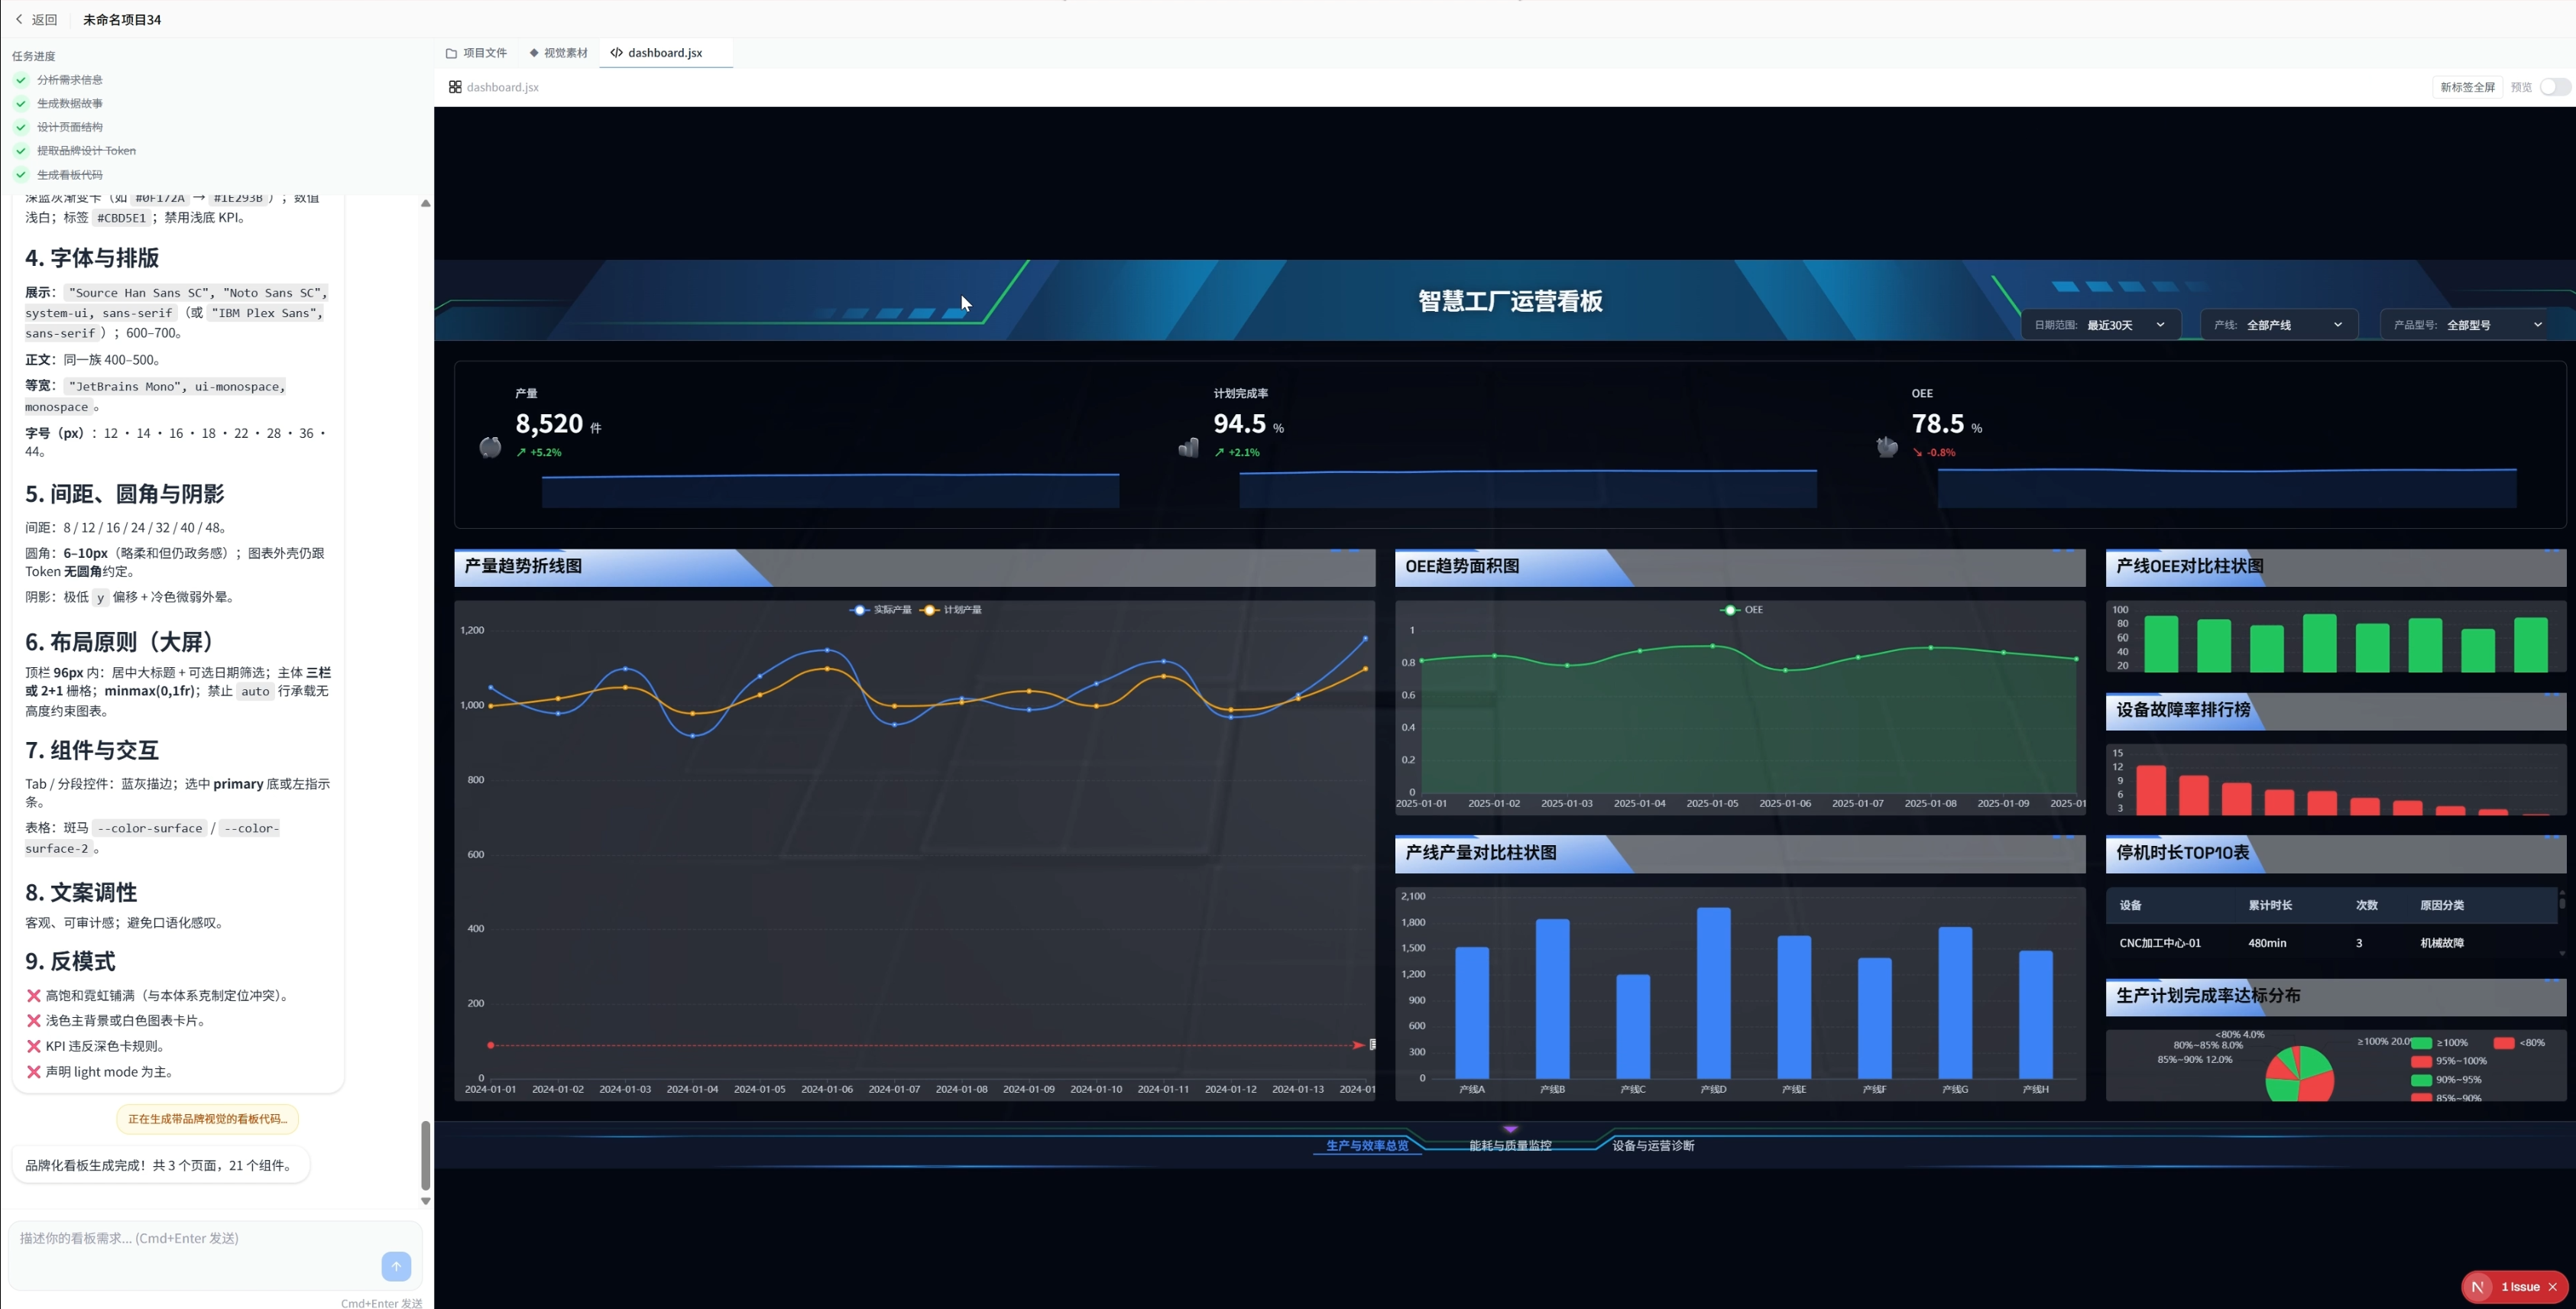
🧠 Markdown + JSX as Deliverables
Markdown captures design decisions (data stories, page structures, VI specs) — structured and semantically explicit
JSX captures the final view as a real, runnable React component rather than an abstract configuration
AI has native comprehension of both formats — no schema mapping or format conversion needed, resulting in significantly higher edit accuracy compared to JSON-based approaches
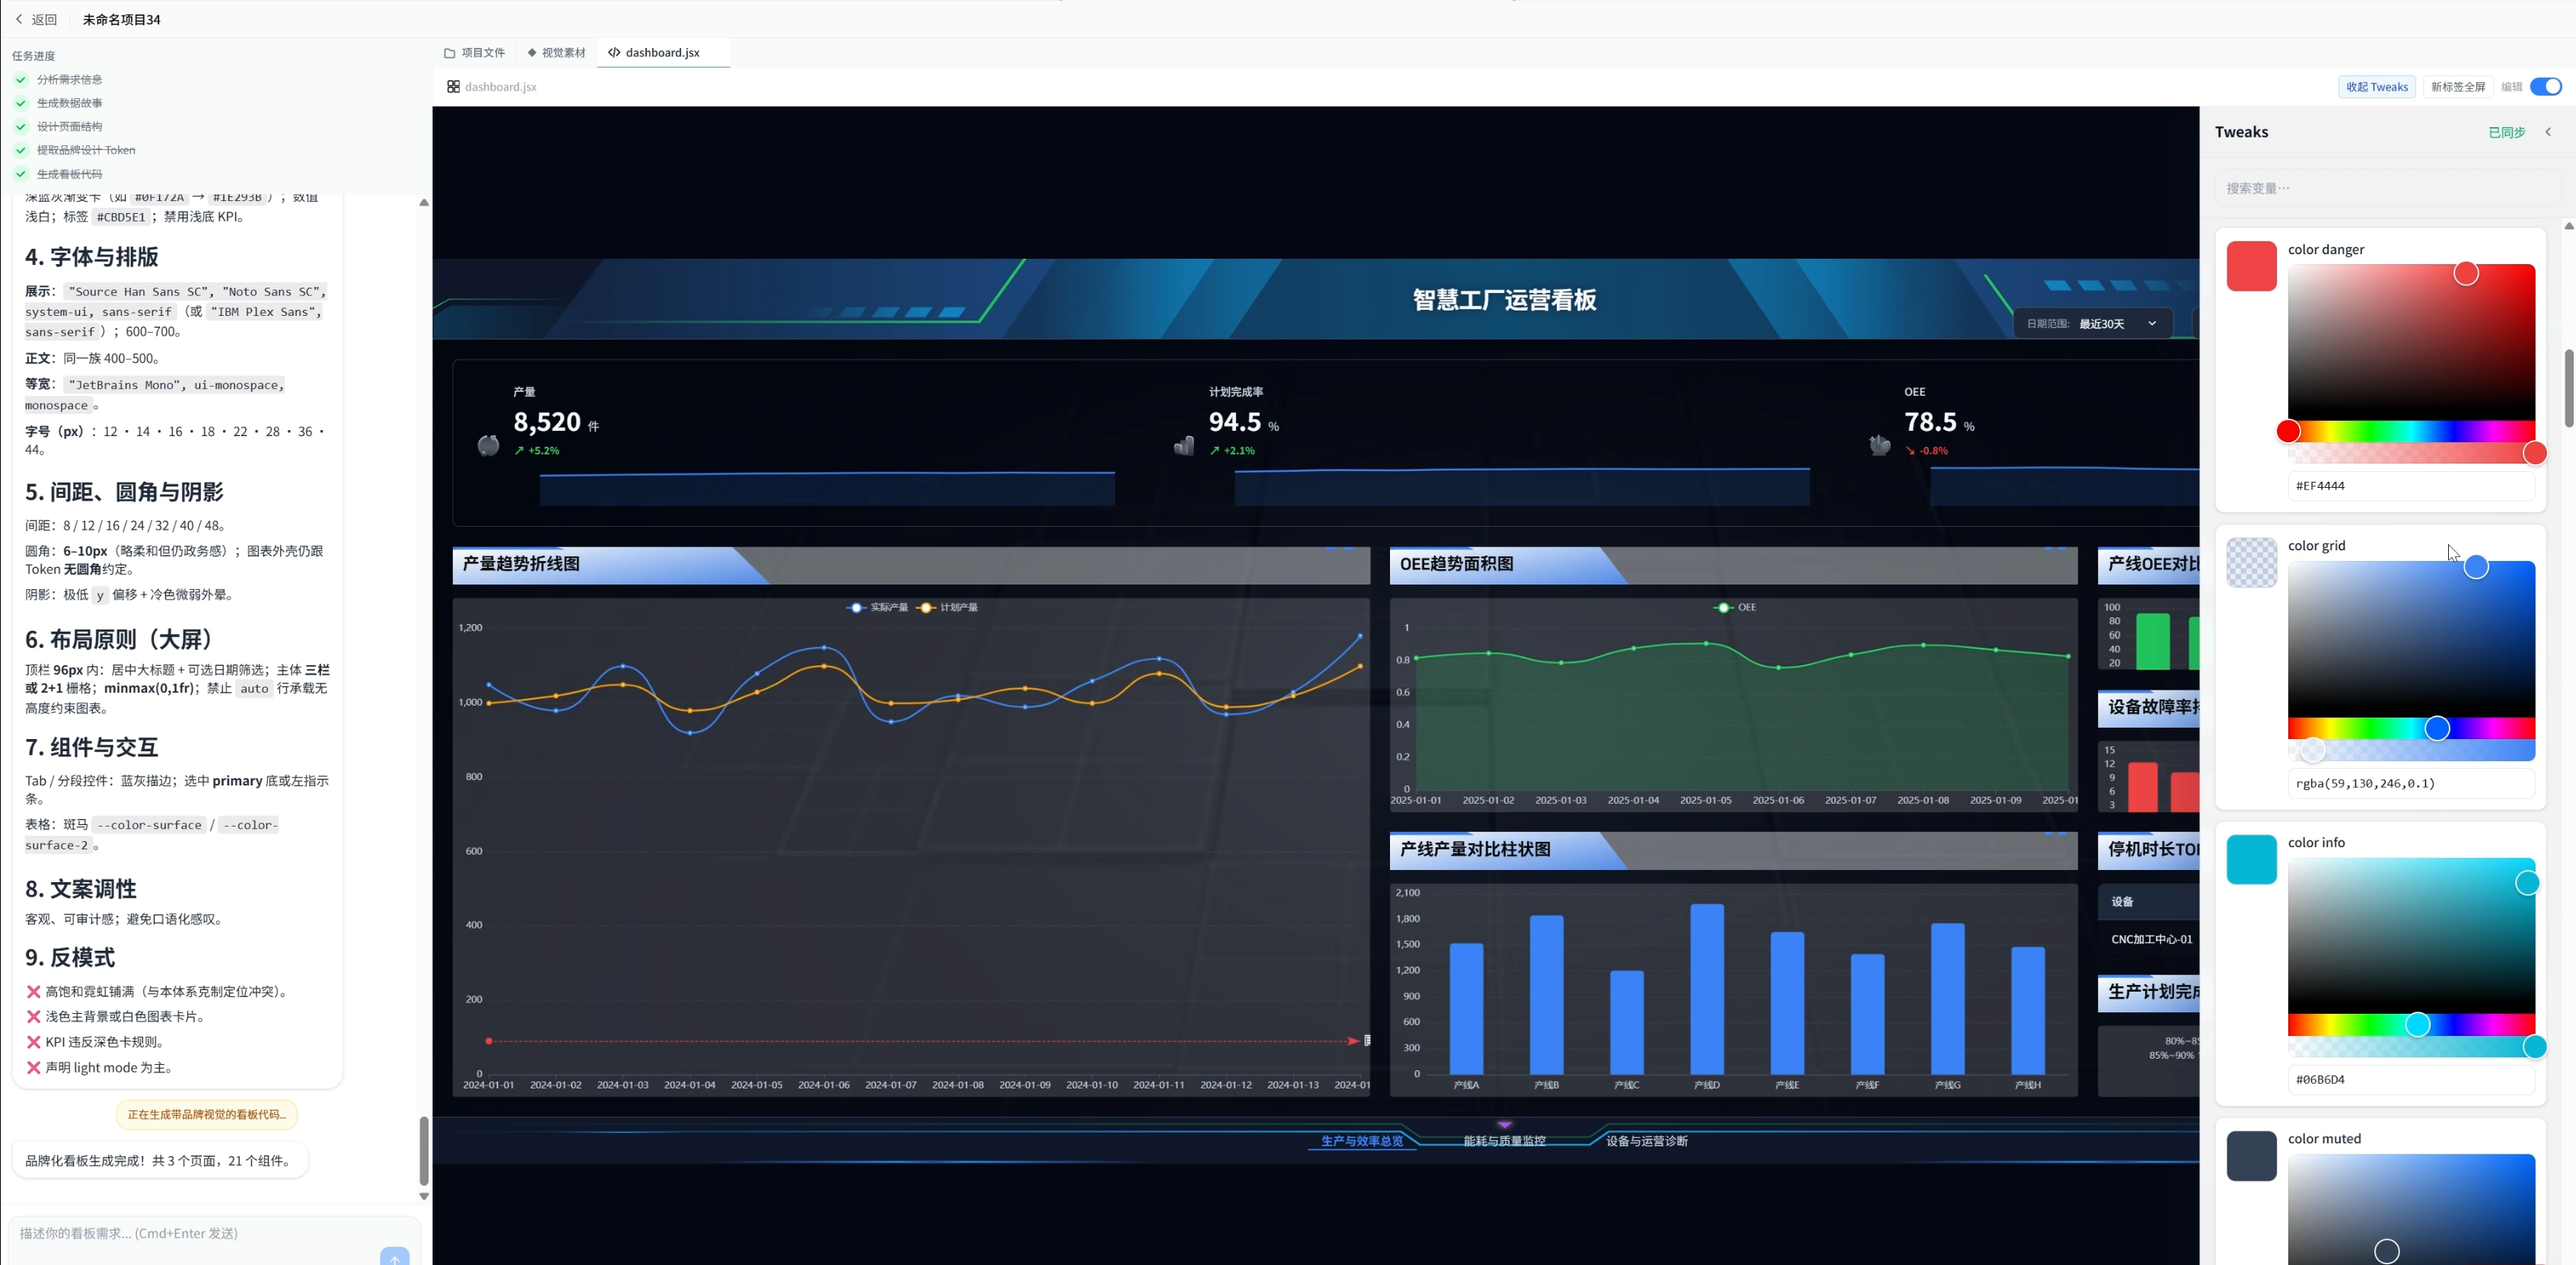
⚡ Real-Time Preview & Tweaking
Live VI Token Editing: Adjust colors, spacing, and typography variables with instant visual feedback
Markdown Partial Refinement: Select a document fragment, describe your intent in natural language, and AI rewrites only the selected portion
Widget-Level Editing: Click any component on the dashboard and modify its data bindings, styles, or layout through conversation
Cascading Regeneration: After modifying upstream documents (data story / page structure), regenerate all downstream artifacts in one click
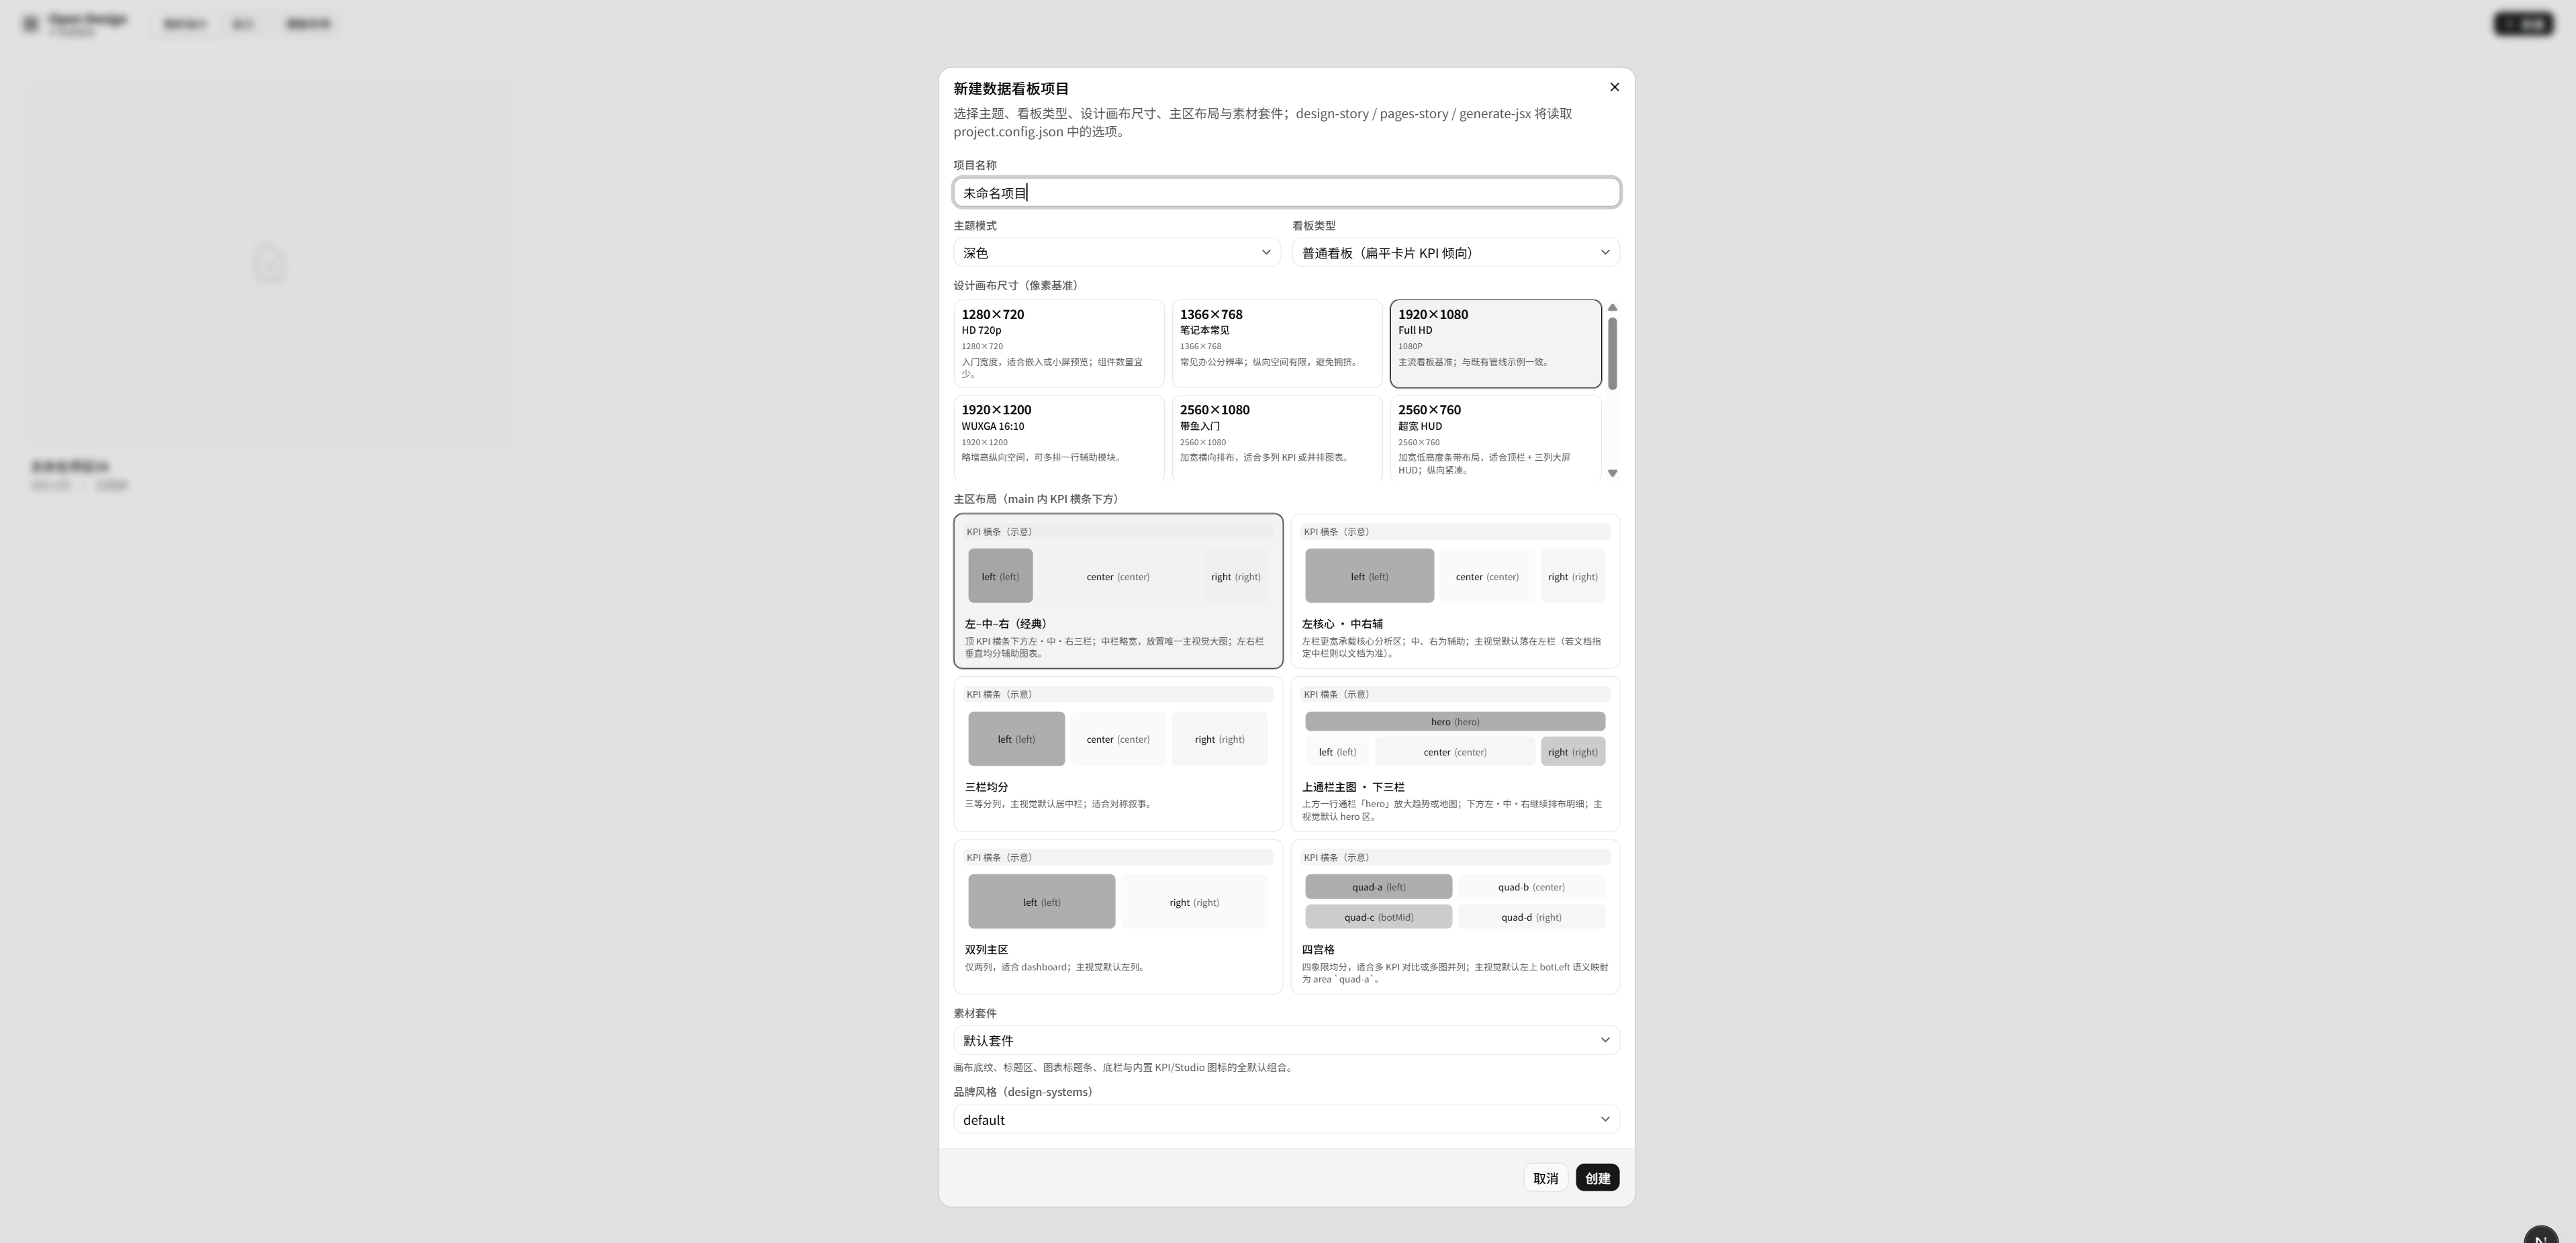
🎨 134+ Design Systems
A built-in library of design system references spanning industries and aesthetics — from brand styles like Apple and BMW to scenario themes like cyberpunk and government blue. Select a style and AI automatically generates matching VI tokens and visual specifications.
🔄 Progressive Generation Pipeline
Requirements → Data Story → Page Structure → VI System → JSX Dashboard
A five-stage pipeline where each step produces an independently reviewable document. Intervene at any stage; downstream artifacts cascade-update automatically.
🌐 Decentralized Storage (Optional)
Integrated with 0G Network for optional decentralized file storage, enabling self-sovereign data ownership. Defaults to local filesystem with zero configuration required.
ハッカソンの進行状況
Project Progress Update
We've reached a functional milestone on Open Design, the AI-powered data dashboard generator. The core pipeline is fully operational end-to-end: users can describe their dashboard needs in natural language and receive a complete, renderable deliverable comprising data stories, page structures, VI specifications, and production-ready JSX components.
What's Shipped
Five-stage generation pipeline — from requirement brief through data story, page structure, VI system, and final JSX dashboard, with each stage producing an independently reviewable artifact
File-based project memory — all project context persists as plain Markdown and JSX files under .dv/, enabling AI to read full project state as long-term memory on every interaction
VI System integration — design tokens are bound to CSS variables and flow through the entire component tree, producing consistent theming across all widgets
Agent editing mode — existing projects support conversational incremental updates, with intent classification routing edits to the appropriate document layer
Real-time tweaking — live VI token adjustments (colors, spacing, typography) and Markdown partial refinement with instant preview
KPI card multi-modal styles — expanded presentation variants covering inline metric groups, classic cards, and hairline surfaces
Template marketplace — pre-built dashboard templates for quick-start scenarios
SVG-to-canvas asset pipeline — optimized visual asset rendering for big-screen scenarios
0G Network storage integration — optional decentralized file storage as an alternative to local filesystem
What's Next
Our next focus is quality tuning of the generated dashboards. The pipeline produces functionally complete outputs, but there's meaningful room to improve the visual polish, layout composition, and overall craft of the end result. Planned work includes:
Layout intelligence — smarter spatial composition, better handling of asymmetric widget groups, and tighter alignment to the target screen preset
Visual hierarchy refinement — improved typography scales, information density calibration, and emphasis patterns that match the selected design system
Chart aesthetic tuning — richer default styling for ECharts widgets, better color harmony across multi-series charts, and context-aware annotations
VI token coherence — stronger cross-component consistency, especially for edge cases like empty states, loading states, and data anomalies
Prompt and reference curation — refining the generation prompts and leveraging the design system library more effectively to produce dashboards that feel intentional rather than merely correct
The goal is to move the generated output from technically valid to visually compelling — dashboards that look like they were crafted by a senior designer, not assembled by a template engine.
link:https://chainscan-galileo.0g.ai/address/0xeed564e34d9dd379dc6f15220534695f50eb1c2d
資金調達の状況
no